Dragoman
Metrics
Dragoman uses Vert.x DropWizard Metrics to gather and emit metrics.
These metrics include size and throughput values for:
- Thread pools
- EventBus
- HTTP server traffic
The metrics output is available in several flavours …
Logs
The MetricsFacade wraps Vert.x’s MetricsService and, using a Vert.x timer, it periodically writes the latest metrics snapshot to the logger: metrics-logger. The periodicity is controller by the application property: metrics.publication.period.in.millis.
Although the metrics output is written in JSON, it is quite verbose so not easily readable (human readable, at least). It is expected that anyone wishing to make use of the logged metrics output will write to file and will use a tool (Graylog perhaps) to ingest that file and provide visualisations of it. To facilitate this approach:
- The
metrics-loggeris always written to file when the-Dlog.dirproperty is supplied at runtime - Each metrics log is written in JSON (for ease of programmatic interrogation) and is accompanied by a timestamp (to help with visualisations-over-time)
HTTP endpoint
The metrics endpoint exposes a JSON representation of the lastest metrics snapshot. By default, this emits the entire snapshot but the response can be qualified by:
- Passing a chosen metric name as a path parameter. For example:
metrics/get-requestswill only return theget-requestsmetric
- Passing a regular expression as a query parameter, the regex will be applied to metric names and only those metrics whose name matches the regex will be returned. For example:
/metrics?regex=responses.*will return only those metrics having a name which starts withresponses
JMX
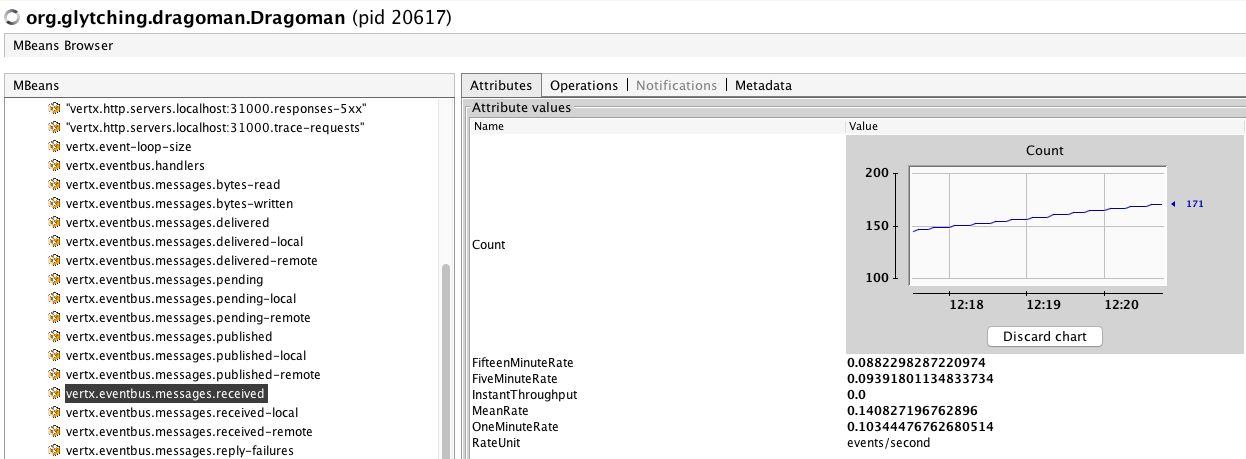
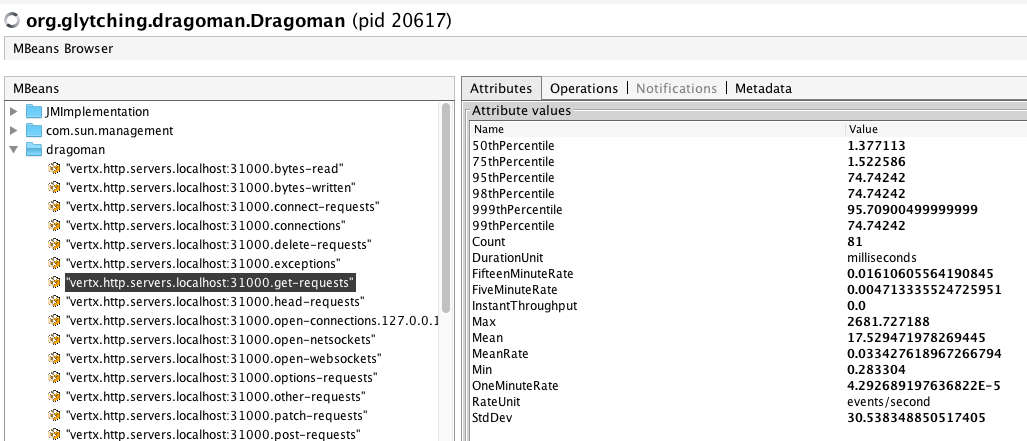
Each metric is exposed via a JMX MBean, all of these MBeans are available in a MBean domain named: dragoman. These MBeans can be accessed using any JMX client. Here’s a screenshot showing some of these MBeans viewed in JVisualVM (after installing the MBeans Browser plugin):
JVisualVM provides some rudimentary visualisation of numeric metrics. If you double click on a numeric value in the attributes tab then a graph will appear, this will be updated as the underlying value changes. For example: