Dragoman
Monitoring Dragoman
Health Checks
Dragoman uses [Dropwizard’s Health Checks](https://dropwizard.github.io/metrics/3.1.0/manual/healthchecks/. The configured healthchecks are available at the /healthcheck HTTP endpoint. Here’s an example of the output:
{

    "IsMongoConnected": {
        "healthy": true,
        "message": "Connected to MongoDB at localhost:27017",
        "error": null
    }

}
If all of the configured health checks are healthy this endpoint will return a 200 status, otherwise it will return a 500 status.
Using JVisualVM
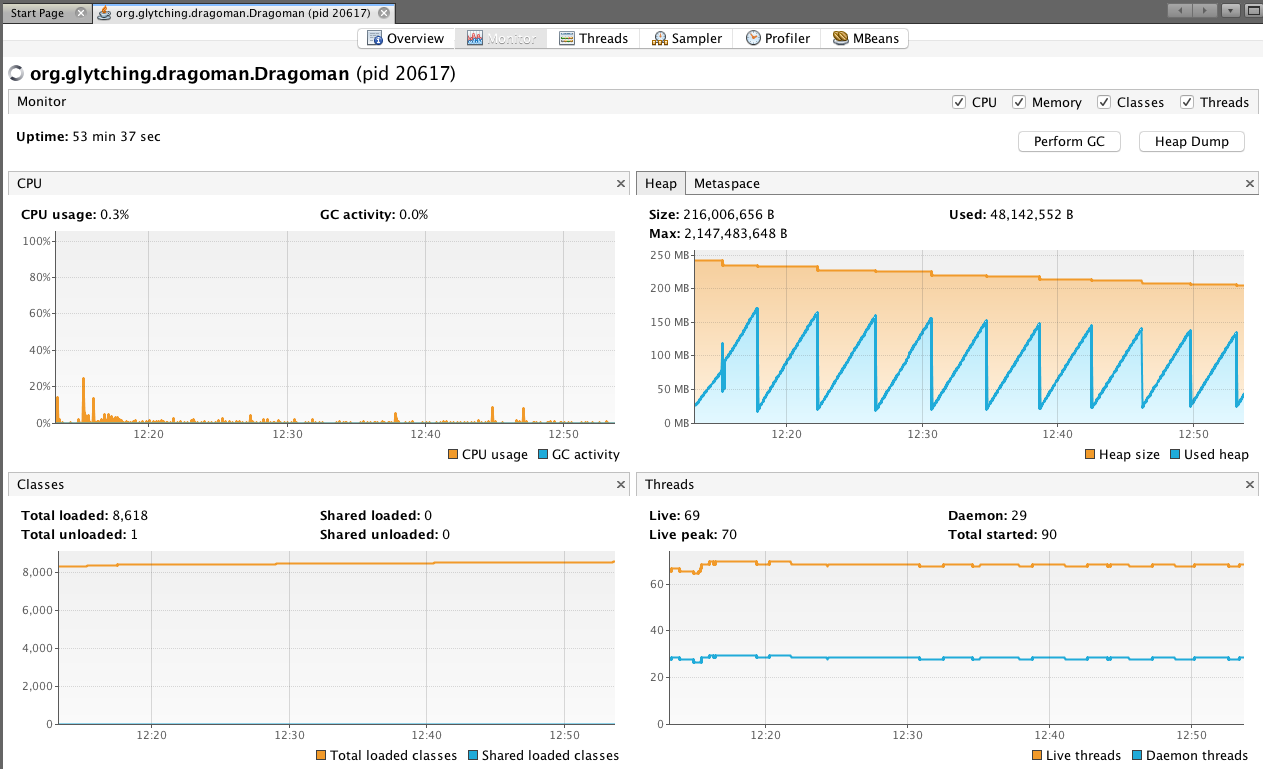
Dragoman is JMX aware, so you can connect to it using JVisualVM. This tool provides a useful Monitor view showing CPU, heap and thread usage. For example:
Using Jolokia and Hawtio
Jolokia is a JMX-HTTP bridge giving an alternative to JSR-160 JMX clients. Hawtio is a modular web console which can consume data exposed by Jolokia.
Dragoman embeds a Jolokia agent running on the port defined by the jolokia.port property in application.properties. If the jolokia.enabled property is `true’ (this is its default value) then this agent will be started when Dragoman is started.
You can confirm that this agent is running by:
-
Looking for this log message:
Starting Jolokia agent on port: ... -
Browsing to this address:
http://<host>:31010/jolokia/where ‘host’ is the name of the host on which Dragoman is running. If the agent is running you’ll get a200response with a JSON payload containing the agent configuration.
Running Hawtio
- Download Hawtio from here and run this from a command line:
java -jar hawtio-app-1.5.5.jar
More details on the Hawtio site.
This will launch a browser instance pointing at the Hawtio dashboard. To connect this to the Jolokia agent running inside Dragoman enter connection details like so …
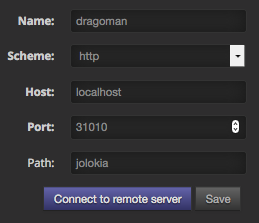
.. and hit Connect to remote server.
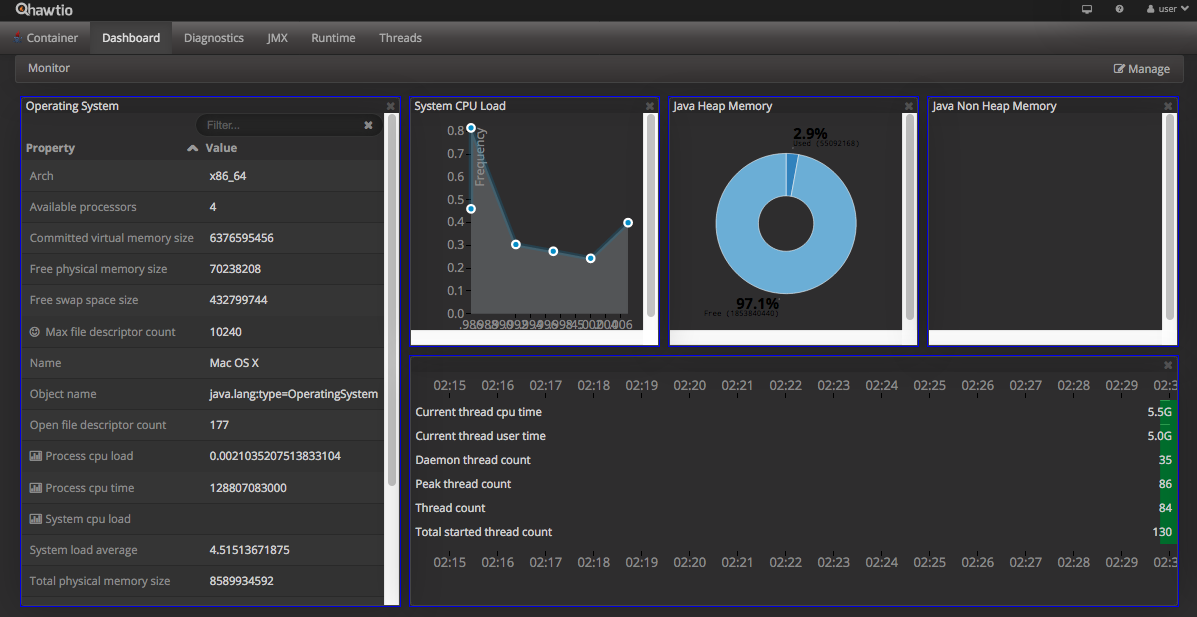
This will launch the Hawtio console for Dragoman, here’s a screenshot: